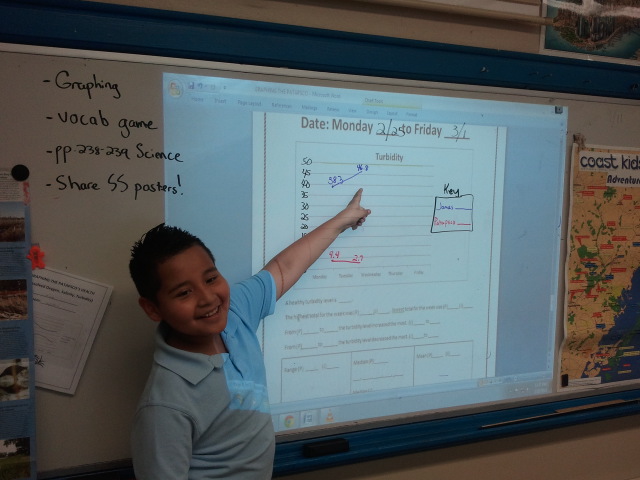
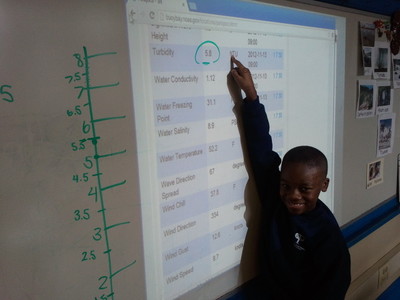
The last two months our students have been charting and graphing the dissolved oxygen, salinity, and turbidity levels of the Patapsco River. Some of it we have done in person aboard the Snow Goose and some of the research has been conducted in the classroom using the NOAA website. At the end of each week the students found the range, median, mode and solved other problems with their data they have collected. This week we added the James River to our graphs. We will be comparing and contrasting the two rivers and discuss the differences. Talk with your children tonight about the graphs and specifically why the James River has a much higer turbidity rate than the Patapsco's!
5 Comments
Each day our students will be charting and graphing the turbidity rate of the Patapsco River. We use information collected from a NOAA buoy at the mouth of the river to graph our information. Ask your children what might affect the turbidity rate of the river and what we can do to prevent it from getting worse. We will be testing the turbidity rate, salinity, and oxygen levels in person aboard the "Snow Goose" next week and again in the Spring! |
Welcome to the 5th Grade Blog!
This blog is dedicated to the fifth grade at Patterson Park Public Charter School in Baltimore, MD. Our hope is that this blog will keep students, parents, and anyone else interested up to date with all that we have going on during the school year. Let us know what you think! Archives
September 2015
Categories
All
|